In the second step, we tested models with engineered features – aggregated variables relating to gene sets provided in the ovarian cancer study [6] and those from the MSigDB Collections [8]. These models performed well locally – that is, on a holdout set. However, they gave significantly lower scores (0.41 in sub-challenge 2) when submitted to the challenge.
We concluded that generalization is an issue in this competition and that batch effects play a role. Moreover, the generalization properties of developed models depend significantly on the type of variables on which the models are built. We addressed this issue explicitly in our final solution by using an auxiliary model to predict how well-selected models generalize: we trained models (on one or two variables) using PNNL data. We tested them on JHU data of the ovarian cancer dataset in sub-challenge 2.
These models enabled us to predict how well the starting model in our forward feature selection algorithm will generalize (in other words – how robust it is against batch effects) and select the best one among a few such starting models. Afterward, we added variables to the chosen starting model in a standard manner – that is, via forward feature selection.
Our final models scored:
- 0.46 (for ovarian cancer) and 0.42 (for breast cancer) in sub-challenge 2,
- 0.29 (for ovarian cancer) and 0.36 (for breast cancer) in sub-challenge 3.
Our Model Architecture
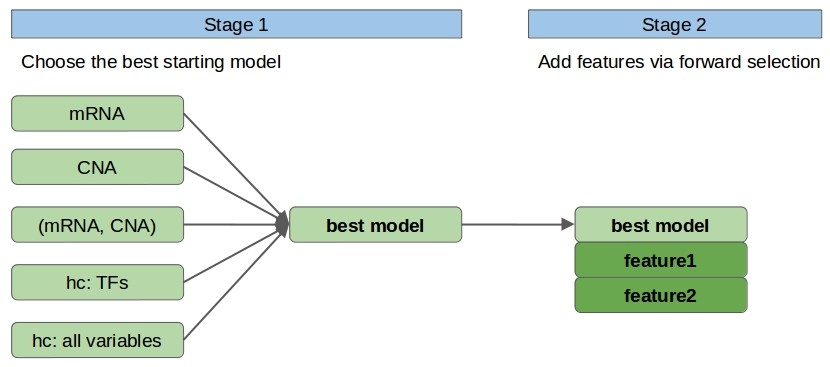
During the challenge, we used a two-stage hierarchical forward feature selection algorithm. The first stage focuses on variables showing good generalization properties as determined by an auxiliary model. We used its residuals in the second stage by fitting them into a separate model.Model Architecture: Stage One
In stage 1, we choose the single, ‘most promising’ model among models built using linear regression on the following sets of 1-2 variables: mRNA, CNA (mRNA, CNA), hc: TFs, hc: all. Here, mRNA and CNA denote the features relating to the considered protein (i.e. with the same GeneID), the only set with two variables is (mRNA and CNA), and by hc, we mean the variable with the highest correlation to the target variable from a given set of variables. In particular hc: TFs denotes the variable chosen among mRNA and CNA of human transcription factors (TFs) [9], whereas hc: all variables denotes the variable chosen among all variables. From the hc: TFs and hc: all candidate feature sets we remove mRNA and CNA relating to the considered protein. We use TFs as a separate set of variables because limiting ourselves to a relevant subset of the original features should decrease noise.
- Fig. 1. Model architecture
Model Architecture: Stage Two
In stage 2, we fit a separate model to the residuals of the model obtained in stage 1. To this end, we use a forward feature selection procedure. For the early-stopping criterion, we consider the cross-validation (CV) score change when adding a variable. We follow a customized cross-validation procedure with five folds and a holdout set. The holdout set (with ~20% of data) is used to obtain a more realistic (not overfit) estimation of model performance. Additionally, we impose a barrier, b, for the enlargement of the model by variable(s) being added. If the considered variable(s) does not improve the CV score by at least b = 0.06 (for ovarian cancer) or b = 0.07 (for breast cancer) it is rejected and the procedure stops. The values of b = 0.06, 0.07 were determined by optimizing for the holdout set score. Note that the feature with the highest correlation to the residuals of the current model is chosen per train-test split in the cross-validation procedure and can even be a different feature for each split.
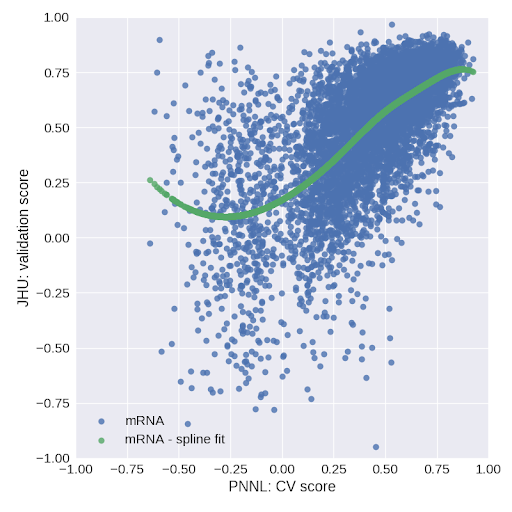
In stage 1 of our algorithm, we choose the best model among several candidate models. Typically the cross-validation score (or holdout set score) can be used for such a task. However, as generalization was an issue in this challenge, we used an auxiliary model for this purpose. Namely, for all proteins in the ovarian dataset of sub-challenge 2, we train the models considered in stage 1 on the PNNL data and test them on the JHU data (cf. Fig. 2).
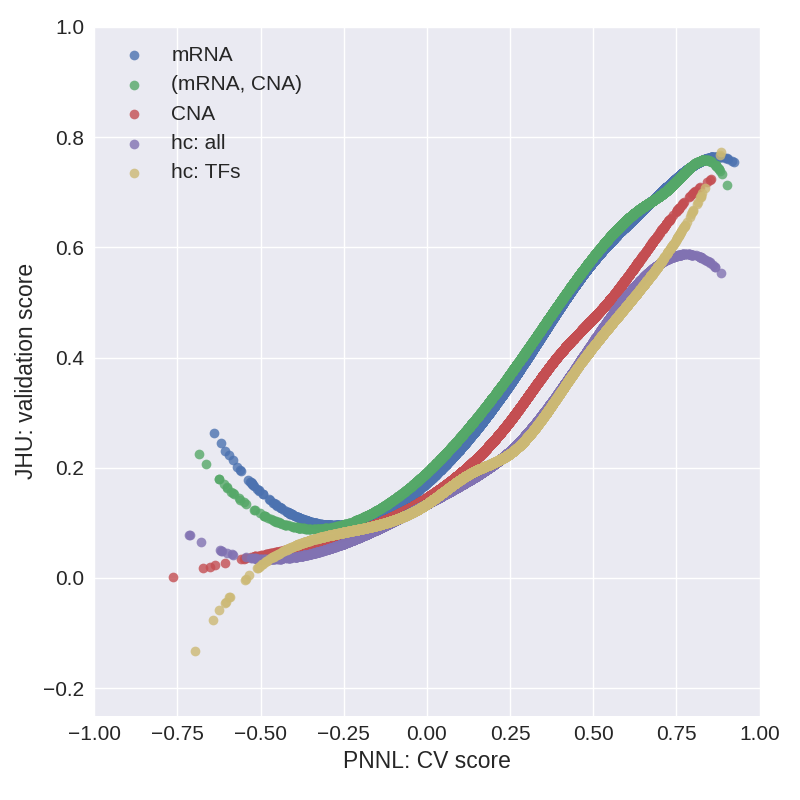
The relation between the CV score on PNNL data and the validation score on JHU data is a measure of how well selected models generalize. We then fit a cubic spline with 4 knots (extrapolated linearly above the fourth knot due to oscillatory behavior in this regime) to the (CV score, validation score) data and use it for predicting the validation score of selected models in stage 1. Figure 3 shows cubic splines obtained in this manner for the models considered in stage 1.
We observe that models built on mRNA or (mRNA, CNA) show the best generalization properties, followed by models built on CNA and then by the hc: all and hc: TFs models. Explicitly, in stage 1 we take the cross-validation score of selected models as a predictor in the auxiliary model and, thereby, we predict the validation score. The predicted validation score is then used for selecting the best model.
-

Fig. 2. Validation score on JHU data versus cross-validation score on PNNL data for stage 1 models trained on mRNA.
-

Fig. 3. Cubic spline fits to the (CV score, validation score) data for models considered in stage 1.