Let me ask you something: Why are we still settling for inefficient tools in one of the most critical industries in the world?
Drug discovery and development—fields that shape the future of healthcare—are still bogged down by outdated systems. Cumbersome Excel files. Fragmented, unorganized data. Endless spreadsheets that do little more than frustrate you. Every day, professionals in these industries are forced to sift through irrelevant data, hoping they’ll find that one nugget of insight. But, here’s the thing—it shouldn’t be this hard.
Do you start your day navigating sluggish systems? Waiting for data that should be at your fingertips? Are you trying to make breakthrough decisions with incomplete information, only to find yourself slowed down by tools that belong in another decade? This isn’t just inefficient; it’s unacceptable.
The future of drug development is data, done right.
The world of drug discovery is evolving. Rapidly. And it’s time the tools you use keep pace with your ambition.
What if, instead of drowning in scattered data, you had systems that gave you immediate, actionable insights? What if your tools didn’t slow you down but actually accelerated your breakthroughs? Imagine a seamless, intuitive experience that lets you focus on what truly matters—pushing the boundaries of science.
This isn’t a dream. It’s happening. Right now. There’s a new generation of solutions designed to simplify the complexity of drug development. Tools that aren’t just efficient—they’re revolutionary.
Work smarter, not harder.
What if you could turn mountains of data into real-time, meaningful insights? What if collaboration between teams was effortless? What if the technology simply worked—so well that it felt invisible?
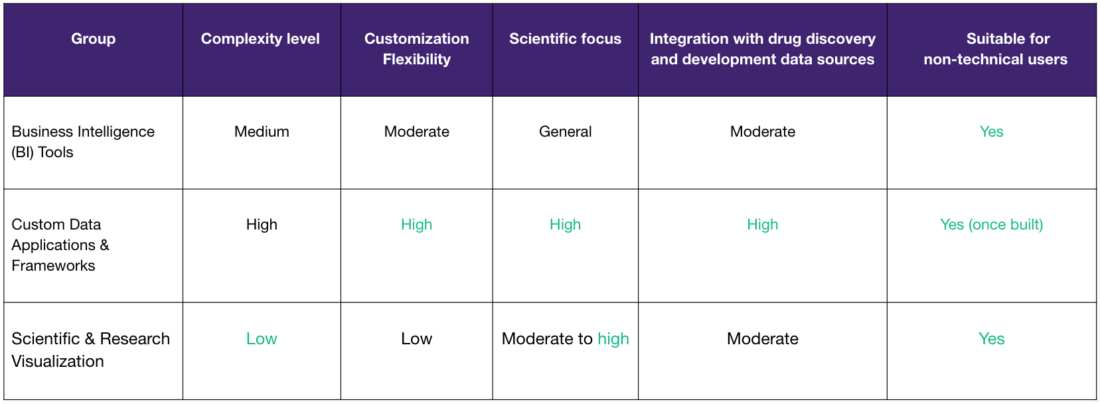
Let’s break it down. The solutions you need fall into a few essential categories:
- – Business Intelligence (BI) Tools that deliver real-time insights and dynamic reporting, giving you instant clarity when it matters most.
- – Custom Data Applications tailored for advanced scientific workflows—so you’re no longer held back by one-size-fits-all software.
- – Scientific Visualization Tools designed to translate complex data into clear, actionable insights—making the abstract tangible.
Data that transforms the way you work
These aren’t just tools. They’re enablers. They don’t complicate your work; they simplify it. They don’t just deliver data; they deliver insights. These are the solutions that allow you to work smarter, faster, and better.
If you’re in biotech or pharma, these innovations are designed for you—to solve the specific challenges you face, to streamline your workflow, to turn complexity into clarity.
Because at the end of the day, it’s not about how much data you have. It’s about what you can do with it. The right tools don’t just help you keep up—they help you leap forward. They empower you to make decisions that save time, resources, and most importantly, lives.
Welcome to the future of drug discovery. The tools are here. The only question is—are you ready to use them?
1. Business Intelligence (BI) tools
BI tools like PowerBI, Spotfire, and Tableau, while primarily developed for business and marketing data, are widely used for data visualization and analysis in drug development, enabling users to monitor clinical trial results, patient outcomes, and research data through interactive dashboards.
Key features for drug discovery and development:
- Easy integration with various data sources, including clinical systems and research databases.
- Real-time dashboards for tracking operational, clinical, and research metrics.
- Predictive analytics capabilities to assist in drug development and trial performance forecasting.
Limitations:
- Limited customization: These tools offer great visualization but are less flexible for highly specific scientific workflows (e.g., omics data analysis).
- Scalability challenges: Handling very large datasets (e.g., genomic or proteomic data) can require external integrations or performance tuning.
- Less suited for complex analytics: While they can integrate with advanced analytics, they are not built for custom statistical models or machine learning workflows natively.
Who should use it:
- Clinical Researchers / Lab Managers: Ideal for tracking clinical trial progress, patient safety, and research KPIs through intuitive dashboards.
- Executives / Decision-Makers: BI tools provide real-time updates on operational and clinical metrics, ensuring that decision-makers have up-to-date information for quick decisions.
- Regulatory Affairs / Compliance Teams: Excellent for generating reports for compliance tracking, regulatory submissions, and safety monitoring.
Relevant Examples:
2. Custom data applications & visualization frameworks
Tailored applications frameworks like RShiny, Streamlit, Dash or Python&JS based stack allow Drug Discovery and Development teams to use tailored web apps for visualizing and analyzing complex scientific data. These frameworks enable development of highly customizable solutions, allowing users to design specific workflows to meet research needs. Also with proper design, the solution can be scaled as the use case complexity rises.
Key features for drug discovery and development:
- Supports integration with specialized scientific packages, such as Bioconductor (R), scikit-learn or tensorflow (Python).
- High level of customization for embedding advanced models, simulations, or algorithms specific to drug development or genomic/proteomic data analysis.
- Ideal for creating tailored scientific apps with complex visualizations.
- High flexibility to integrate with public, proprietary and in-house data sources.
Limitations:
- Requires programming skills: There is a need for R or Python knowledge, to build a solution for a scientific team, that can be later managed in a no-code manner.
- Initial investment: Building and maintaining custom apps requires a data infrastructure and a development team that can build a solution with R/Python.
- Lack of pre-built templates: Unlike BI tools, custom frameworks don’t come with out-of-the-box dashboards, so more effort is needed to build from scratch.
Who should use it:
- Scientists / Researchers: Custom Data Applications are ideal for advanced scientific analysis and workflows, especially for omics data, complex models, and simulations.
- High Throughput / Large Scale experiments: Tailored applications are perfect for processing and consumption of high throughput or large scale datasets that wouldn’t fit into simple dashboarding solutions
- Fast paced start-ups: Duke to the scalability of a solution, custom solution can start leas and be scaled to work as the complexity rises
- Data Scientists: These platforms provide full control for embedding machine learning models and building interactive applications.
Relevant examples:
3. Scientific & research visualization tools
Scientific and research visualization tools like GraphPad Prism and Plotly focus on creating domain-specific visualizations, also for Drug Discovery research. These tools are tailored for use in experimental design, statistical analysis, and data presentation.
Key features for drug discovery and development:
- Provides domain-specific graphs and charts for statistical analysis, like dose-response or survival curves.
- Supports visualizations of highly specialized data (e.g., genomics, proteomics) essential for research presentations or regulatory reports.
- Ideal for biostatistical and clinical research.
Limitations:
- Limited interactivity: Some tools may have less interactivity compared to full-fledged dashboards, making them less suitable for exploratory data analysis.
- Limited scalability: Handling large-scale omics data or real-time data streams can be challenging, requiring integration with other tools.
- Single-purpose tools: These platforms are highly specialized for specific visualization tasks but may not cover broader analytics or visualization needs.
Who should use it:
- Scientists / Researchers: Suited for biostatistical and experimental research analysis, offering tools for specific scientific visualizations and publication grade plotting.
- Students / Academic Teachers: Perfect for exploration of different approaches for data and research visualization including laboratory reports, data analysis assignments etc.
- Regulatory Affairs / Compliance Teams: Can be used for preparing polished visualizations for reports and submissions to regulatory bodies.
Relevant examples:
In this post, we explored three key categories of data consumption tools that are transforming workflows in biotech and pharma—Business Intelligence (BI) Tools, Custom Data Applications and Scientific Visualization Tools. Each offers unique advantages for streamlining data analysis, enhancing decision-making, and improving collaboration. However, for organizations looking to tailor their solutions to specific scientific needs and scale as complexity grows, Custom Data Applications provide the most flexibility and power.
At Ardigen, we specialize in building end to end data solutions designed to scale with your growing data and business requirements. Whether it requires managing complex bioinformatics workflows, integrating large datasets, development of AI modules or building intuitive apps for scientific research, we can help develop a scalable, user-friendly solution that meets your specific needs. Let us partner with you to accelerate your data-driven innovation.
Further Reading from Ardigen’s Knowledge Hub
Explore more strategies for leveraging data and AI in drug discovery: